
Dear subscribers,
This is update #1627 for Sunday night, February 12, 2012.
Today's main topic is scintillating scenarios.
In a sharp reversal from their consistent outperformance throughout January 2012, commodity-related shares persistently underperformed in February. GDXJ peaked on February 2, and then most commodity shares topped out the following day shortly after positive economic data was released at 10:00 a.m. Eastern Time (following a positive U.S. employment report at 8:30 a.m.), with the VIX simultaneously slumping to 16.10. Every single day beginning on February 3, commodity shares began forming numerous lower highs while increasingly underperforming the broader equity market. This process may have reached a temporary oversold condition on February 10, as these downtrends accelerated dramatically especially for funds such as GDXJ, KOL, and XME (charts can be seen below for all of these and related funds).
As the Greek parliament has ratified the terms for agreeing to austerity measures, global equities are mostly higher with general U.S. equity index futures gaining about a half percent overnight.
The human brain tends to heavily overweight recent events in forecasting the future:
This mostly dates back to the time when humans had to adjust rapidly to changing weather conditions. Those who said to themselves, "This strange cold front is nothing to worry about; we'll keep eating and dressing the same as before," didn't survive one of several Ice Ages. Those who adapted most rapidly to changing conditions as though they would be permanent ended up surviving to the next generation--thus making very scarce those humans who can impartially balance recent events with past tendencies.
Fund flows showed an unusually bullish tilt in recent days:
One sure sign of a dangerous bubble is when those who are closest to it perceive the most irrational pricings as being "normal". Those who live in Arizona or Florida will shake their heads at the foolishness of today's ridiculous prices in Toronto, whereas those in Vancouver might believe they are going to rise further (and could even be right in the short run):
Below is my current asset allocation as of Friday's official closing prices. Next to each asset in parentheses is the average opening price:
CURRENT ASSET ALLOCATION, marked to market at the close on February 10, 2012.
My own personal funds are currently allocated as follows:
LONG POSITIONS:
TIAA/CREF Traditional Annuity Fund and Putnam Stable Value Fund (retirement funds with stable principal paying variable interest
averaging 3.00%, no ticker symbols), 28.8%;
Local checking accounts averaging 0.80%, brokerage accounts averaging 0.50%, and other cash equivalents, 63.8%;
Coins and related collectibles (gold, 295; silver, 4.25) purchased in 1997-2005, 6.1%;
Claymore natural gas futures fund CYMGF (37.25) or GAS-T (Toronto), 1.3%;
Steel manufacturing equity fund SLX (48.05), 0.0% [closed at 57.14 on Thursday, February 9, 2012];
Sea shipping equity fund SEA (15.73), 0.0% [closed at 17.62 on Thursday, February 9, 2012];
Uranium mining equity fund URA (9.0861), 0.0% [closed at 10.27 on Thursday, February 9, 2012];
Mid- and small-cap gold mining fund GDXJ (26.24 [24.65 post-dividend of 1.59]), 0.0% [closed at 29.22 on Thursday, February 9, 2012];
Vanguard mid-cap fund VEMPX (about 86.50, equivalent to VXF), 0.0% [closed at 109.02 on Thursday, February 9, 2012];
Vanguard small-cap fund VSMAX (29.64, equivalent to VB), 0.0% [closed at 36.75 on Thursday, February 9, 2012];
German equity fund EWG (17.48), 0.0% [closed at 22.58 on Thursday, February 9, 2012];
Egyptian equity fund EGPT (11.26), 0.0% [closed at 12.23 on Thursday, February 9, 2012];
Solar energy fund TAN (2.70 [2.47 post dividend of 0.22]), 0.0% [closed at 3.63 on Thursday, February 9, 2012];
Turkish equity fund TUR (44.99), 0.0% [closed at 51.63 on Thursday, February 9, 2012].
SHORT POSITIONS: None.
Silver bullion fund SLV (28.78), 0.0% [closed at an average price of 27.90 in the pre-market session on Monday, September 26, 2011].
All new comments below are shown in boldface to make them more easily visible.
Because I sold all of my equity funds throughout the day on February 9, I currently have 92.6% of my total net worth in the safest possible investments with no principal fluctuation. I will maintain this position until there are sufficiently compelling investments to warrant taking action of some kind.
My favorite charting site is StockCharts.com. All of the charts below are three-year candlestick charts with a 41-week (roughly a 200-day) moving average, except for those funds which have been trading for fewer than two years such as GDXJ, and for which I therefore created shorter-term charts. If you have an e-mail server which is blocking any of these charts, insert the update into Microsoft Word. The charts will probably "magically" appear. If not, you can find the latest TLT chart at http://kaplankrew.com/charts/tlt120212.png . If you replace TLT with GDX, you'll see the GDX chart, and so on. For charts from any other week, use the closest Sunday date in YYMMDD format.
This is my long-term outlook for the next dozen or so years: we will almost surely have a very deep bottom for nearly all equities and commodities during 2013-2014, followed by a powerful inflationary bull market through 2016-2019, then another major bear market which will likely bottom in 2018-2021, and then another strong multi-year bull market as we transition to the next era of prosperity. While your friends and colleagues (and some stray cousins) are doing the opposite, continue to buy low and sell high.
TLT is a fund of U.S. Treasuries averaging 28 years to maturity. It has the advantage of being highly liquid, with millions of shares traded daily--and even more millions whenever it is near an important turning point--and usually with a bid-ask spread of one cent. It also tends to pay about one dollar in dividends each quarter, credited monthly, which yields over 4% if it is purchased below 100. The interest is also free of state and local taxes if you are a U.S. resident; if you are not a U.S. resident, then you get the advantage of having your assets denominated in U.S. dollars which can be especially rewarding since TLT usually tends to gain in value while the greenback is simultaneously climbing against nearly all global currencies. Periodically, hedge funds and some other institutions pile into it, as they did for example in the fourth quarter of 2008. Since late July 2011, investors worldwide have flooded out of risk assets and into U.S. Treasuries for numerous reasons, including the Fed's decision to sell short-dated Treasuries in order to purchase long-dated ones, which is known as "the twist". The anticipation of this event was more than fully priced into TLT's notable overvaluation which surpassed its December 2008 top by about 1-1/2 percent when it peaked at 125.03 at 10 a.m. on October 4, 2011. TLT thereafter appears to have completed a bearish double top, having touched 124.02 at 3:45 p.m. on December 19, 2011. Additional short-term rally attempts may occur in the near future. This double top will likely be followed by a downtrend which I expect will progressively accelerate until it provides one or more ideal buying opportunities during the first half of 2012:
TLT remains enormously above its simple 200-day moving average. It is possible that if global equities complete some form of double top or head-and-shoulders top during the first half of 2012, TLT will become cheaper during the forming of the "right shoulder" rather than when most general equity indices are peaking. Be patient and wait for TLT to slump below its 200dma before purchasing it.
ZROZ, like TLT, is a fund of U.S. Treasuries averaging 28 years to maturity, except that ZROZ consists of zero-coupon Treasuries instead of actual Treasuries. This means that ZROZ is twice as volatile as TLT in both directions, without using artificial leverage or any other additives or preservatives. Its risk-reward scenario is therefore identical to TLT. I believe that the next time I am buying TLT, I will be simultaneously accumulating ZROZ, perhaps in a ratio of 2 dollars in TLT for each dollar in ZROZ. One problem with ZROZ is its lack of liquidity; the total daily volume is low, plus the bid-ask spread can sometimes exceed 0.4% of its value and tends to average about one third of one percent. You will therefore end up overpaying about 0.17% each time you buy it, and you will end up selling it for 0.17% below its actual value whenever you close it out:

SPY is the world's first exchange-traded fund, introduced in 1993, and which has always enjoyed the biggest total assets of any ETF except for brief periods of time during recent weeks when GLD has periodically held the top spot. SPY tracks the S&P 500, which invests in the top 500 U.S. corporations as measured by market capitalization. This index is more abused than any other: chartists love to try to use it as a leading indicator even though it is a classic lagging measure of the general equity market, while other traders love to buy leveraged S&P 500 funds in either direction even though such funds rapidly erode as time passes. It is much more intelligent to never trade SPY, and to use it merely as a gauge of the U.S. large-cap equity market, especially since so many amateurs attempt to extrapolate the S&P 500 itself to reach faulty technical-analysis conclusions:

At 10 a.m. on October 4, 2011, the S&P 500 completed an important intermediate-term bottom at 1074.77, its lowest mark since September 1, 2010. If the S&P 500 climbs above its May 2, 2011 recovery peak of 1370.58, this will likely lead to a brief, intense rally as momentum players worldwide loudly proclaim a false "upside breakout". This will probably represent an excellent selling and short-selling opportunity for global equities. I have no idea whether this will happen or not, but if it does, I plan to sell short various equity funds and perhaps to purchase HDGE and/or PSQ.
An alternate gauge of the health of U.S. equities can be found with QQQ, which is a capitalization-weighted fund of the 100 biggest Nasdaq companies. QQQ sometimes likes to set higher highs even as SPY is forming lower highs, as we saw in October 2007 and again in May-July 2011, and perhaps yet again in February 2012. At 3:10 p.m. on Thursday, February 9, 2012, QQQ reached 62.98, its most elevated point since February 6, 2001, thus achieving an eleven-year high:

Semiconductor shares have tended to lead the general equity market in both directions since the late 1960s. In early 2003, for example, they were much more energetic in rallying before most other general equity indices caught onto the bullish trend. In 2006-2007, they were among the first subsectors to consistently form a bearish pattern of lower highs, and then in 2008-2009 they made several higher lows even as the S&P 500 was grinding out lower 12-1/2-year lows. SMH had been outperforming the broader equity market from early August 2011 through early February 2012, but has shown modest weakness in recent days along with very heavy insider selling of the shares of semiconductor producers:

Even if you don't trade gold mining shares, you should follow them since they give valuable clues as to the upcoming behavior of nearly all assets. GDX finally broke out of its leisurely downtrend to set a new all-time high, but was quickly seen to be a false breakout. The astonishing underperformance of GDX relative to GLD (gold bullion) and SLV (silver bullion) tells me that inflation is likely a transient phenomenon at this point in the business cycle, and it will probably be a few years before inflationary expectations will be truly realized. Since GDX has essentially moved sideways while gold and silver bullion have soared, this probably is forecasting significantly lower bullion prices for all precious metals over the next year or two. Precious metals and their shares had originally appeared to "decouple" from other risk assets in late 2007-early 2008, and again in the summer of 2011, but later caught up dramatically on the downside and will probably trade like most other risk assets during most of the next year or two:
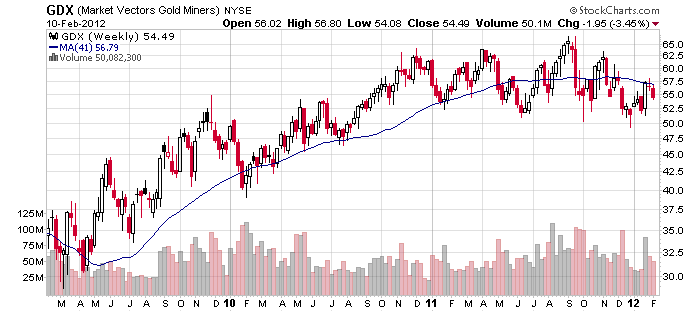
GDX completed a 9:30 a.m. bottom on December 29, 2011 at 49.22, which was its lowest point since August 24, 2010.
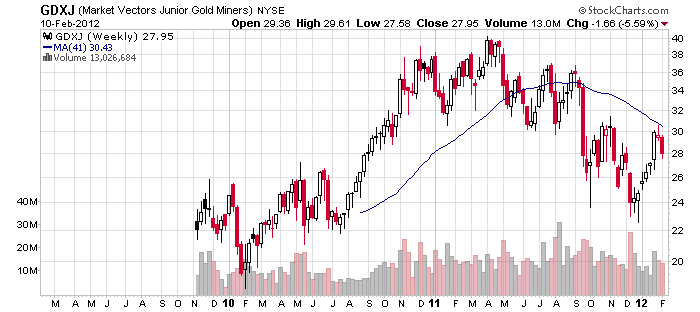
GDXJ is a fund of mid- and small-cap gold producers which behaves differently from its large-cap older brother GDX. GDXJ made numerous false downside breakouts during the fourth quarter of 2011, including its December 29, 2011 bottom of 22.58 at 9:35 a.m., its lowest price in 17 months, each of which I used as a buying opportunity:
During the summer of 2009, the historic ratio between crude oil and natural gas suddenly doubled. This has caused actual consumption of natural gas to increase relative to crude oil, with everything else remaining essentially unchanged. At some point--although who knows whether this will be in 2012, 2014, 2020, or 2040--this ratio will have to be restored to its normal historic relationship. My guess is that it will likely be relatively sooner rather than later, since long-established historic relationships don't usually remain illogically out of synchronization when people can choose to actually use the commodities being considered. For example, if the ratio between corn and rice is out of line by 3:1, then people will grow so much more corn and eat so much more rice that the normal ratio will eventually be restored:

The ratio of crude oil to natural gas for part of January and February 2012 traded at more than four times its historic average.
KOL is a fund of coal mining shares which was my favorite candidate for purchase in November 2008, and which tends to lead the shares of many other commodity producers as well as serving as a leading indicator for general equity indices. KOL had slumped sufficiently to make it compelling for purchase on October 3-4, 2011, especially since numerous components had experienced notable insider buying:

Along with numerous other important leading-indicator equity funds including GDXJ and XME, KOL had outperformed the broader equity market throughout January 2012 and then consistently underperformed in February. KOL's behavior was one of the primary reasons I decided to unload all of my equity fund positions throughout the day on Thursday, February 9, 2012.
VIX remains one of the most reliable gauges of investors' fear of an impending bear market. On April 28, 2011, VIX slumped to 14.27, an absolutely astonishingly low level which indicated the nearly complete indifference toward the possibility of a bear market earlier this year. In sharp contrast, VIX surged to 48.00 at the close on August 8, 2011, when almost everyone was certain that the stock market would continue to go lower in the short run--and possibly much lower. Since then, VIX had formed a pattern of several lower highs including 46.88 at 10 a.m. on October 4, 2011, which was strongly suggestive of an impending powerful global equity rally--and is precisely what occurred. Whenever VIX returns to the mid-teens, I am going to sell some or all of my equity funds. I did exactly that on February 9, 2012, selling all of them. The level of VIX was one reason that I did so, although the persistent underperformance of commodity shares was a more compelling justification. VIX slumped to an intraday bottom of 16.10 at 10:00 a.m. on Friday, February 3, 2012, which marked its lowest point in nearly seven months and could be signaling that a major equity zenith is approaching:

In the long run, I remain strongly bullish on the U.S. dollar through 2014, and I expect the U.S. dollar index to peak between 100 and 120 where it has not been since 2003. In the short run, I expect the U.S. dollar to rally moderately:

Sometime during the first half of 2012, but probably not soon, the huge pro-greenback speculative bets are likely to be convincingly flushed out as the U.S. dollar index slumps to 76 or 75 during the next several months.
Some investors believe the Baltic Dry Index serves as a far-forward leading indicator for risk assets. This index measures the cost of shipping heavy commodities such as iron ore by large ships. This index has shown dramatic recent weakness, which may have negative implications for risk assets later in 2012:

Into all deep lows during the second half of 2011, including August 8 and October 3-4, I recommended several exchange-traded funds for purchase. My largest position is SLX, a fund of steel manufacturers which tends to be reliable in reflecting minor changes in equity valuations and consistently outperforms during equity rallies:

Steel manufacturing enjoyed a surge of buying by top corporate insiders in this subsector whenever its valuations were near the lowest points of the recent cycle.
Another industry with intense insider buying near late 2011 lows has been SEA, a fund of sea shipping companies, which has the additional contrarian advantage of consisting of several Greek shipping companies which because of the Greek connection had become even more irrationally depressed:

Uranium shares as a group plummeted 68.5% from their early 2011 peaks, making funds such as URA irrationally oversold and undervalued:

Among developed equity markets, Germany fell incredibly out of favor during September and early October 2011, encouraging me to buy shares of the exchange-traded fund EWG. I enjoyed the biggest percentage gains with this fund as compared with all others:

EWI is a chart of Italian shares which had become notably undervalued with repeatedly negative media coverage and trading suspended in the shares of at least one major financial institution:

TUR, a fund of Turkish shares, had fallen the most in percentage terms of all single-country exchange-traded funds as of the second week of August 2011:

In late September, Egypt became the world's least popular equity market, and therefore I bought a small quantity of EGPT:

Alternative energy had become so unpopular that many shares of alternative-energy producers slumped below their bottoms of late 2008 and early 2009. Very few other global subsectors can make such a claim. TAN is one such fund of solar-power shares which broke below its 2008-2009 nadir, and had been among the top-performing exchange-traded funds in 2012 and the only one on which I obtained a total return of about 50%:

I bought a small quantity of TAN near its lowest points in November-December 2011.
KWT, another fund of solar-power shares, also slumped underneath its 2008-2009 bottom and has behaved similarly to TAN:

FAN, a fund of wind-power shares, fell below its 2008-2009 nadir and from late December 2011 through early February 2012 was nearly as strong as solar shares:

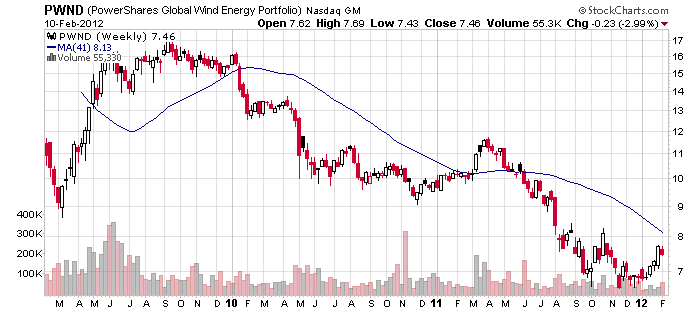
PWND, another fund of wind-power shares and perhaps the most volatile of all alternative-energy funds, plunged to a new all-time low in late 2011 and thereafter rebounded like FAN:
It takes guts to buy into alternative energy which relies on unpredictable government subsidies and is downgraded more frequently than the water level at the Dead Sea, but is probably a good choice precisely for these reasons. If you prefer something with a less challenging pedigree, then XME, a fund of metals and mining shares which had fallen dramatically out of favor, is probably much safer if perhaps somewhat less exciting as long as you only purchase it into recent extended weakness:

Today's main topic is scintillating scenarios.
The most important ingredient to investing success is knowing exactly what you will do no matter what the global financial markets do. If you have a plan for each contingency, then you will surely succeed. Below are several possible paths which could occur during the next several months, and how I would respond to each one:
This could happen in February, or March, or at any time during the next several months. Perhaps the S&P 500 will suddenly rally toward 1400 or beyond. Possibly gold will surge to a new all-time high. Maybe QQQ will surpass last week's 11-year high or SMH will find an extra burst of strength regardless of the heavy insider selling in semiconductor shares. After all, anything is possible in the short run. In this case, the overloved QQQ would represent an excellent short position, or those who don't mind ingesting some artificial preservatives could buy PSQ. HDGE would be an excellent choice, in spite of its confiscatory 1.85% management fee, to take advantage of a false upside breakout for equities since the most speculative shares will probably be among the most overvalued securities and they dominate this high-beta fund of short equity positions. It may even make sense to short GLD and/or SLV if their bullish behavior becomes exaggerated. I considered and rejected the idea of selling short equity funds during the past week, but add on several percent more and I'm going to go ahead and take the plunge.
This is the opposite of the previous scenario, and would be far more lucrative since you can usually make more money in a bull market than in a bear market. GDXJ reached 30.55 on February 2, 2012 and touched 27.58 on February 10 before closing at 27.96. Thus, Friday's low may have represented half of its total pullback if it completes a bottom of 24.61 per share (and more than half if it bottoms near 25). I would certainly want to be a major buyer of GDXJ near 25 or below, and therefore I have already been placing good-until-cancelled purchase orders to do exactly that. Just as you could have made plenty of money by just trading TLT during the past several years, the same is true with GDX and GDXJ, except that you have to be more careful with gold mining shares because of their much higher volatility. If you buy GDXJ ten percent too high, that's close to perfect timing. Similarly, if any of the equity funds featured in the above charts become irrationally oversold during the next several months, then they should be considered for purchase. Regardless of how the financial markets behave during the next few years, we are likely to experience some especially sharp upward bounces for various equity funds along the way.
With the sole exception of 2009, when U.S. Treasuries were collapsing due to the powerful stock-market rebound from historic lows, U.S. Treasuries have presented an excellent buying opportunity at least once per year since I began my updates in February 2006, and I have taken advantage of all of them. I can't be absolutely certain about 2012, but I would guess that we have more than a 90% probability of experiencing yet another very good buying opportunity for TLT. In this case, it won't likely be in the high 80s, but more likely in the upper 90s or perhaps just above 100 dollars per share where the best bargains will be obtained. Buying at 100 will be highly worthwhile if TLT later rallies to 130-140, plus it will continue to pay its monthly dividends averaging nearly 4% annually. The more that analysts become convinced that Treasuries can't retreat sharply, the more likely that they will eventually do exactly that. I would expect the most likely date for a Treasury bottom to be May 2012, but of course that is just a guess. As long-time subscribers know, I make decisions based not upon absolute price or time targets, but upon how my most reliable signals are behaving.
This would become one of the most important events of the year, especially if it were accompanied by the euro traders' commitments showing commercials only modestly net long the euro--or even moderately net short as they had been a year ago. This would set the stage for a prolonged U.S. dollar rally which would likely continue for more than two years. Besides serving as a signal to buy U.S. Treasuries if they are cheap enough, it would become a major short-selling signal for global equities in whichever sectors have the most insider selling and have which sport the most overstretched valuations.
We may even experience two higher lows for the U.S. dollar index in 2012. If that occurs, then we should get two trading opportunities instead of just one. Through 2014, there will be an amazing number of chances to do all kinds of trading; the most difficult emotion to suppress will be the tendency to be constantly buying and selling. When I sold on Thursday, several subscribers who can't bear being in cash wanted to know why I wasn't selling short. The primary reason is that I would prefer to do so with the U.S. dollar index at a level from which there is very little remaining downside. Without warning, the greenback could suddenly plunge, at least in the short run, which would be strongly supportive of equities and commodities and high-yield corporate bonds, and which would be not so friendly to short positions in risk assets.
Yes, I was kidding. I included this to see if anyone was paying attention. While many things are possible in the financial markets, an extended uptrend for real estate is the one event which cannot possibly occur. Far more likely is a global collapse, with the biggest losses occurring in those areas which are experiencing the most overvalued prices relative to rents and incomes, which have interest-only and other exotic mortgages with the lowest down payment percentages, and which have gained the most in recent years relative to the rest of the world. Especially depressed areas like Detroit, Phoenix, or Orlando could indeed begin a rally which lasts for years and possibly even for decades, and may in fact have already done so. Atlanta has slumped so badly during the past year that it is probably approaching a bottom. During the next few years, many more cities will join the above in the list of global neighborhoods which are well below fair value. While an argument can be made for purchasing nearly any liquid asset at some point during the next few years, don't buy real estate in most regions until the U.S. dollar is close to its next major zenith--which is perhaps another 2-1/2 years into the future.
Extremes in implied volatility often signal impending trading opportunities. The February 3, 2012 plunge to 16.10 triggered the beginning of the downtrend for most shares of commodity producers. The surge to 48.00 on August 8, 2011 coincided with a major bottom for QQQ at 49.53 in the after-hours session that day. We could have one more unusually low VIX reading in 2012, and one, two, or even three highly elevated spikes. It is important to keep in mind that VIX extremes tend to correlate with corresponding inverse extremes for some subsectors, but rarely for the broader equity market. You therefore can't trade the S&P 500 itself using VIX, since there is usually a delay between a VIX extreme and a subsequent reversal for broader equity indices and funds.
Dare I suggest that Apple (AAPL) will complete a bubble top in 2012? Google was wildly adored in 2007, and then plummeted by two thirds in value. Apple is even more loved today than Google had been at that time. Certainly there are several dozen assets which will be seen in hindsight as the equivalent of the "Nifty Fifty" from early 1973. Each era has its bubbles; few are able to recognize them before they occur, which is not surprising. What is more puzzling is that even fewer choose to profit from the inevitable collapse of these highly inflated assets. If you notice anything becoming irrationally overloved and overbought in 2012, don't be afraid of selling it short. The very heavy insider selling of technology shares in recent days probably suggests that QQQ will become a very good short position in the near future.
No one knows in advance which if any of the above scenarios will actually come to pass. The point is not to try to figure out which ones will happen and to place orders now, but to be flexible enough to know exactly how you will make money if any of the above eventually occur.
Take care.
--Steve